

VD absorption
Detect bars where an outsized volume delta failed to move price, using volatility-scaled thresholds.
A large volume delta with little price movement can suggest absorption: passive orders may be meeting aggressive buying or selling. This example flags that pattern using data.vd and two thresholds adjusted for recent market activity.
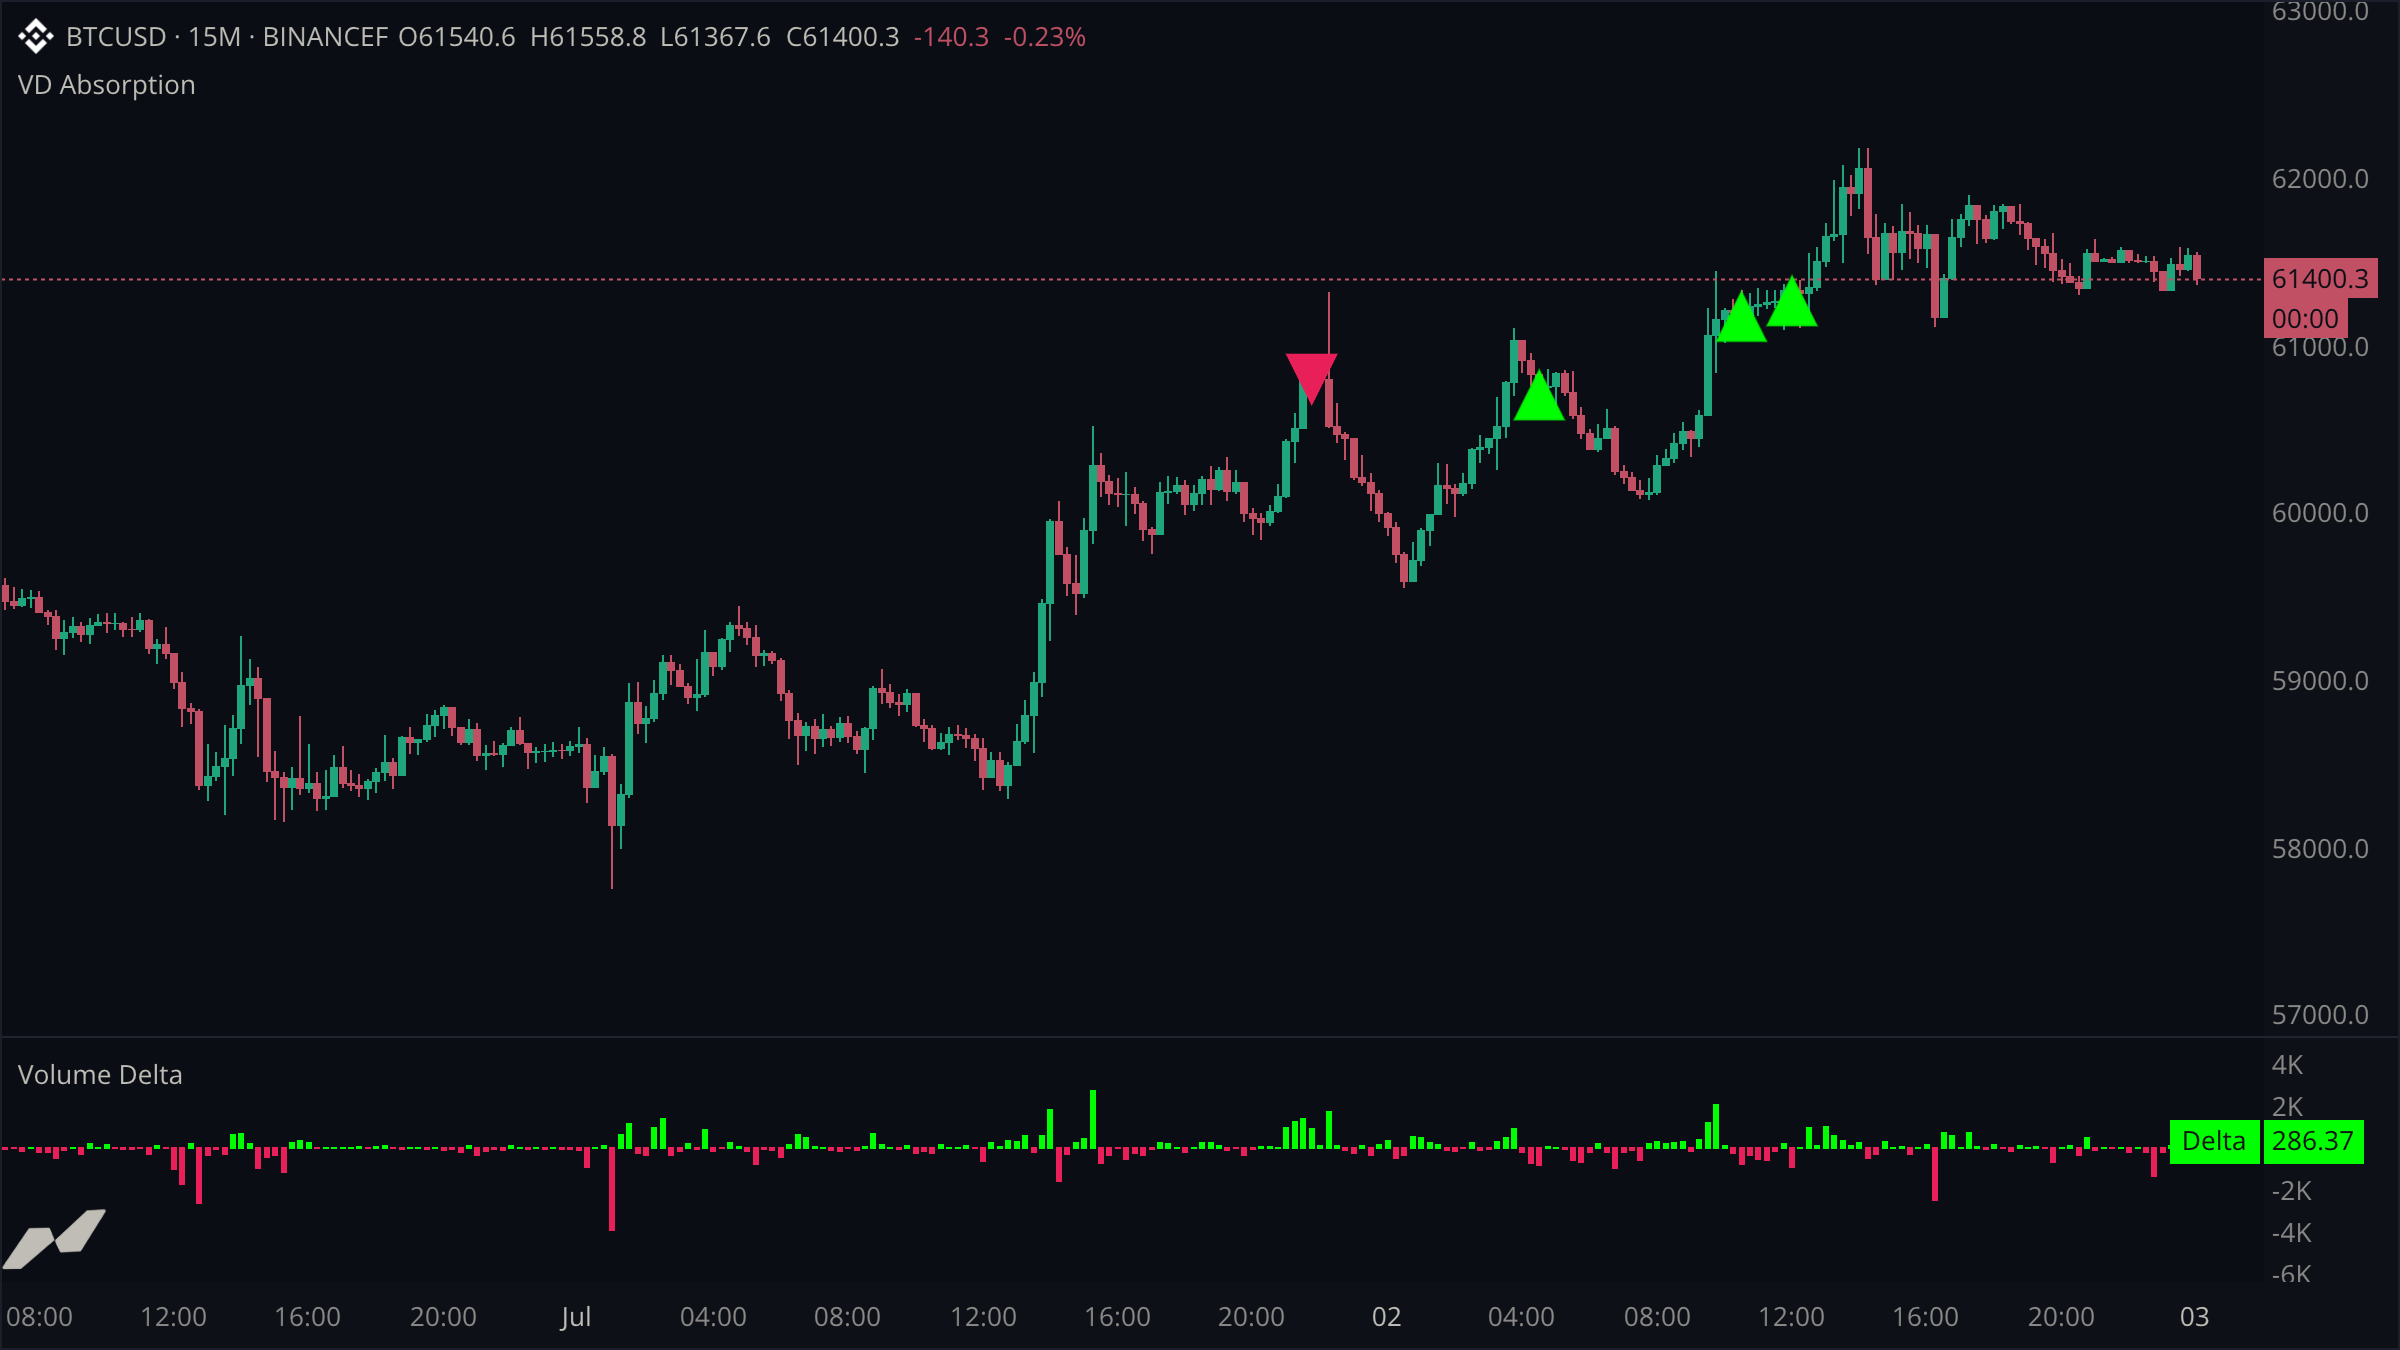
script "VD Absorption"

data chart = subscribe(data.ohlcv)
data vd = subscribe(data.vd)

input (
  deltaMult = input.float(2.0, title: "Delta Spike (x avg)", min: 1.0, max: 10.0)
  rangeMult = input.float(0.8, title: "Max Range (x ATR)", min: 0.1, max: 2.0)
)

pane deltaPane = pane(title: "Volume Delta", height: 0.3)

plot (
  deltaPlot = plot.histogram(title: "Delta", on: deltaPane)
  absorbBuy  = plot.marker(title: "Sell Absorption", shape: shape.up, color: color.green, size: 12)
  absorbSell = plot.marker(title: "Buy Absorption", shape: shape.down, color: color.red, size: 12)
)

on chart.update {
  let delta = vd.close
  let bullish = (delta ?? 0.0) >= 0.0
  deltaPlot.plot(delta, color: bullish ? color.up : color.down)

  // Absorption: an outsized delta that failed to move price. Both baselines
  // are volatility-scaled so the thresholds survive regime changes.
  let avgAbs = ta.sma(math.abs(delta ?? 0.0), 48)
  let atr = chart.atr(14)
  let range = (chart.high ?? 0.0) - (chart.low ?? 0.0)
  let gap: float? = null
  if delta == null || avgAbs == null || atr == null {
    absorbBuy.plot(gap)
    absorbSell.plot(gap)
    return
  }

  let spike = math.abs(delta ?? 0.0) > (avgAbs ?? 0.0) * deltaMult
  let stuck = range < (atr ?? 0.0) * rangeMult

  // Heavy selling absorbed without downside: someone is buying it all.
  absorbBuy.plot(spike && stuck && (delta ?? 0.0) < 0.0 ? chart.low : gap)
  // Heavy buying absorbed without upside.
  absorbSell.plot(spike && stuck && (delta ?? 0.0) > 0.0 ? chart.high : gap)
}
Scale thresholds to the market, not to numbers
A fixed "delta over 500" rule breaks the moment volatility changes. Both conditions here are relative: the delta must beat its own recent average absolute size, and the bar's range must sit below a fraction of ATR. The defaults transfer across symbols because nothing in them is denominated in contracts or dollars.
The signal reads against the delta's sign
An up marker shows heavy selling with little price movement. The plot name, "Sell Absorption", identifies the side being absorbed. The pattern is a signal to inspect, not proof of a reversal.
The delta pane doubles as context
The same vd.close that feeds the detector is drawn as a plain colored histogram, so every marker can be sanity-checked against the bar that produced it.