

OI regimes
Classify each bar by the price and open-interest direction pair and color the OI change accordingly.
Price direction alone cannot tell you whether a move is new positioning or old positioning closing. Pairing it with data.oi splits every bar into one of four regimes, colored on the open-interest change histogram.
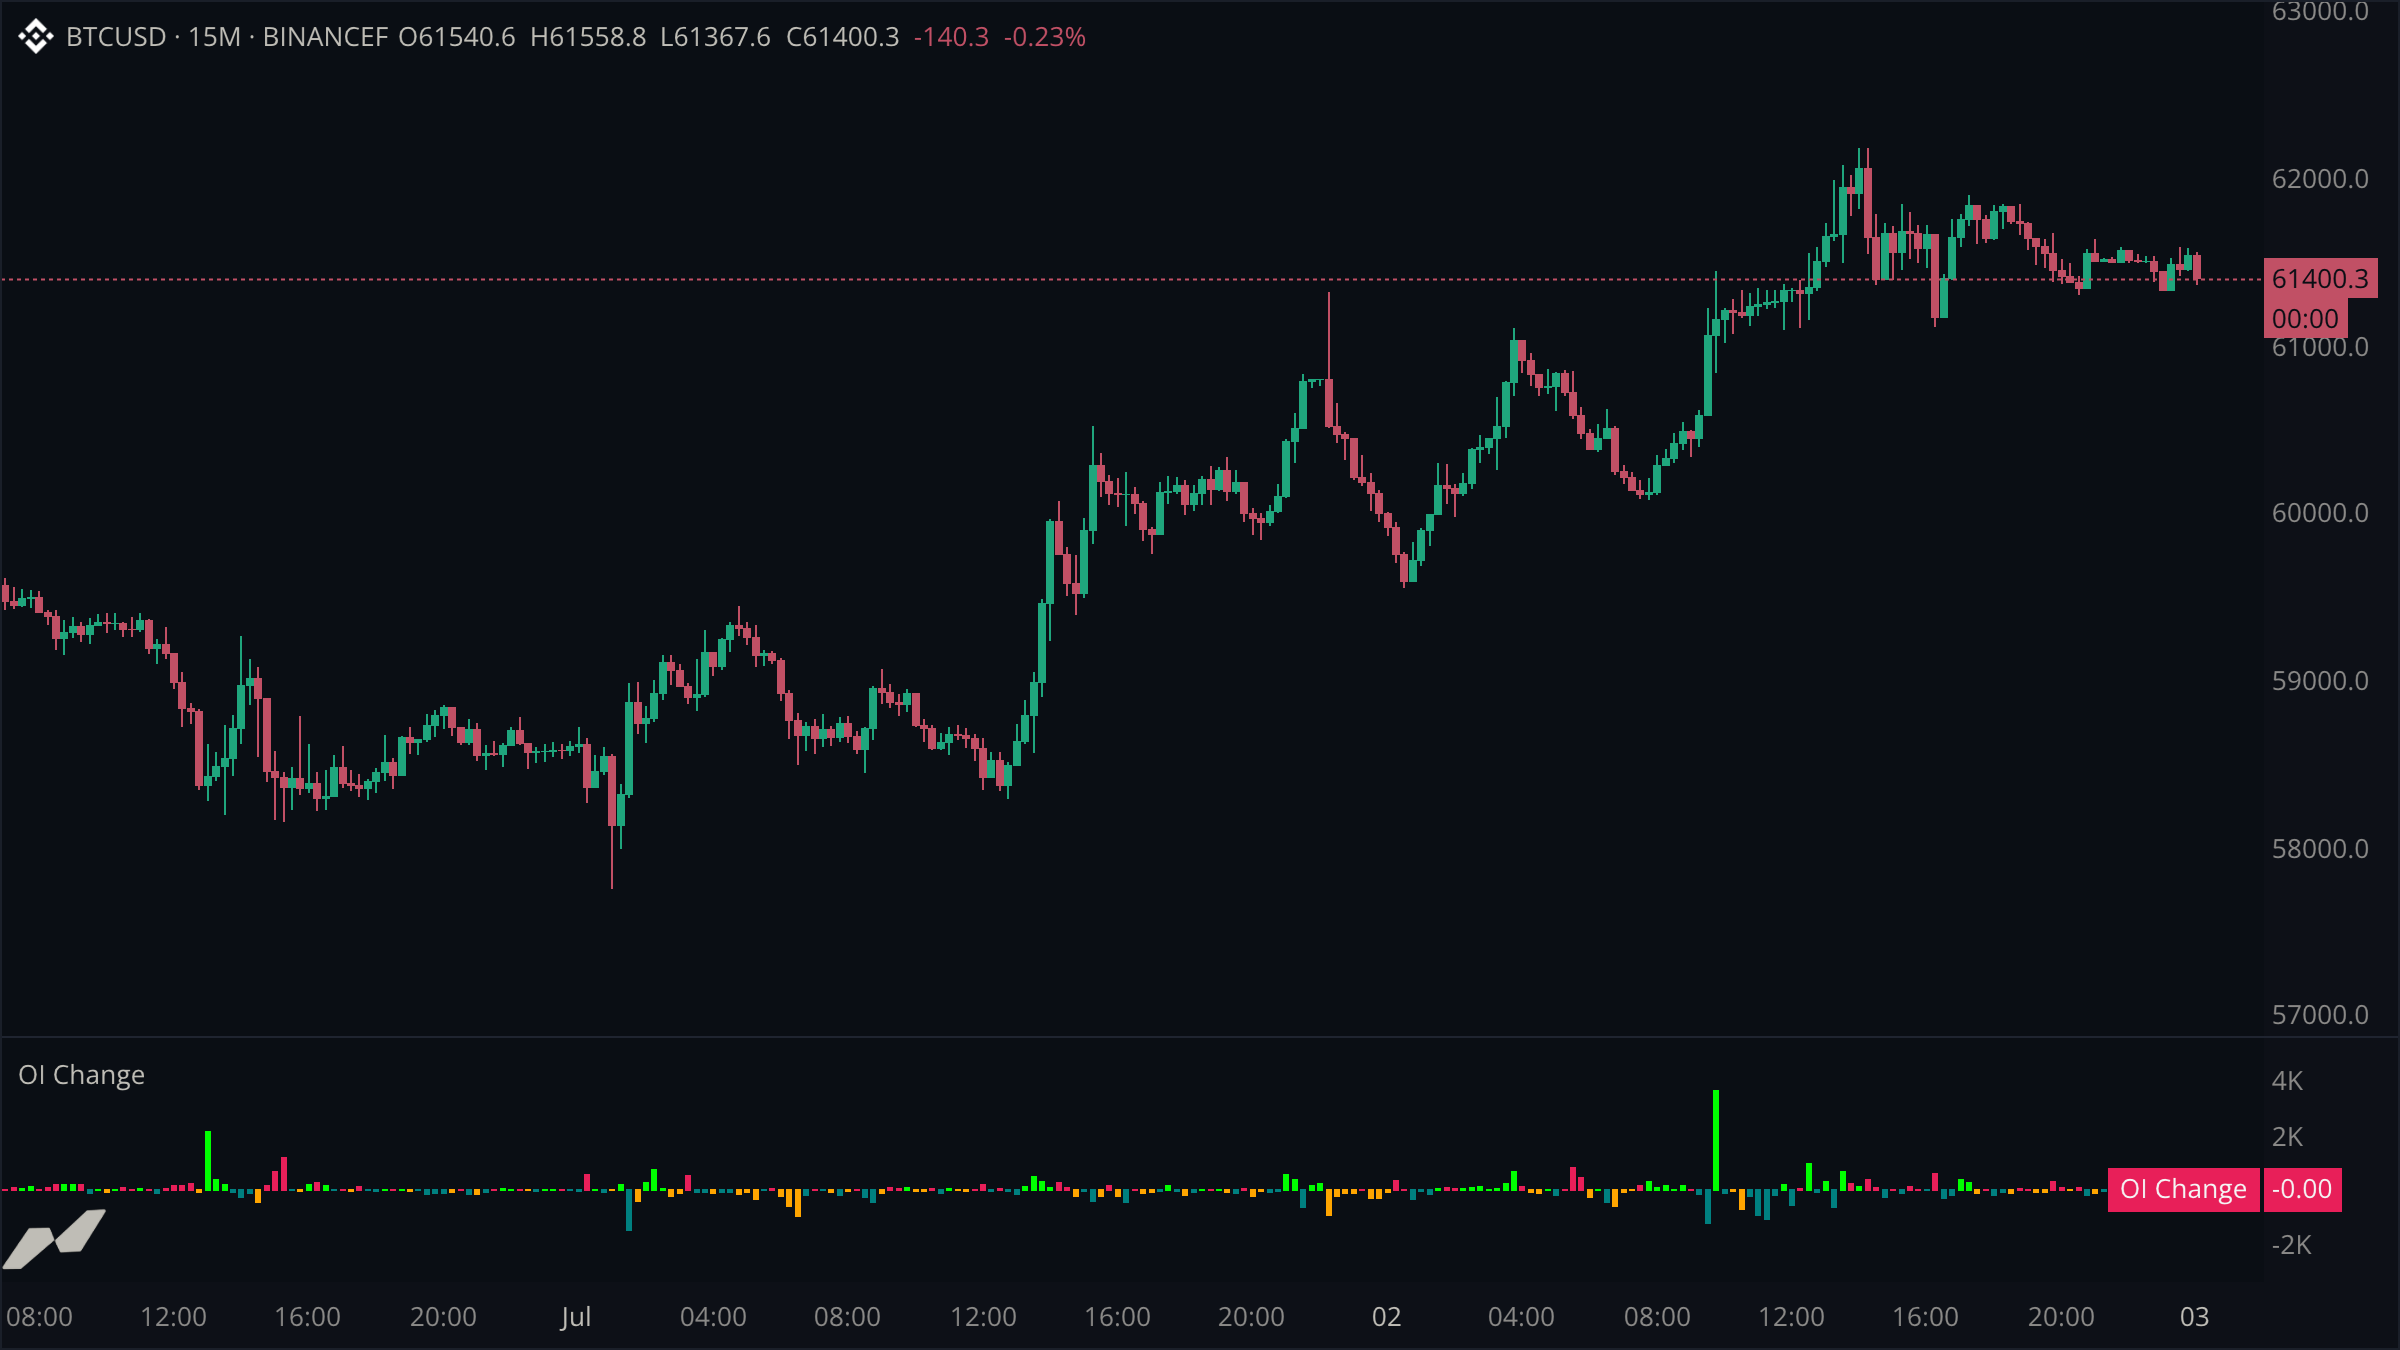
script "OI Regimes"

data chart = subscribe(data.ohlcv)
data oi = subscribe(data.oi)

pane regimePane = pane(title: "OI Change", height: 0.3)

plot oiChange = plot.histogram(title: "OI Change", on: regimePane)

on chart.update {
  let priceUp = (chart.close ?? 0.0) >= (chart.open ?? 0.0)
  let dOi = ta.change(oi.close, 1)
  if dOi == null {
    return
  }
  let oiUp = (dOi ?? 0.0) >= 0.0

  // Four regimes from the price/OI direction pair:
  //   price up + OI up     = new longs opening      (green)
  //   price down + OI up   = new shorts opening     (red)
  //   price up + OI down   = shorts covering        (teal)
  //   price down + OI down = longs closing          (orange)
  let regime = priceUp ? (oiUp ? color.green : color.teal) : (oiUp ? color.red : color.orange)

  oiChange.plot(dOi, color: regime)
}
Why change, not level
Open interest itself is a large, slowly drifting number; plotting it beside its own per-bar change crushes the histogram into a flat line. ta.change(oi.close, 1) isolates the part that carries per-bar information. Plot the raw level in its own pane if you want both.
Four regimes, four colors
Rising OI indicates a net increase in open positions. This example labels a price rise with rising OI as new longs and a price fall as new shorts. With falling OI, it labels a rally as short covering and a decline as long liquidation. These are interpretations of price and OI together; OI alone does not identify which side drove the move.
Returning early beats plotting zero
Before the second OI bar exists there is no change to classify. The early return leaves the histogram empty instead of inventing a zero bar with an arbitrary regime color.