

CVD divergence
Compare price swings against cumulative volume delta and mark divergences between the two.
This example pairs the chart with data.cvd and looks for the classic disagreement: price makes a new swing while cumulative volume delta refuses to confirm it. It covers a second data stream, reading a series at a historical offset, and anchored markers.
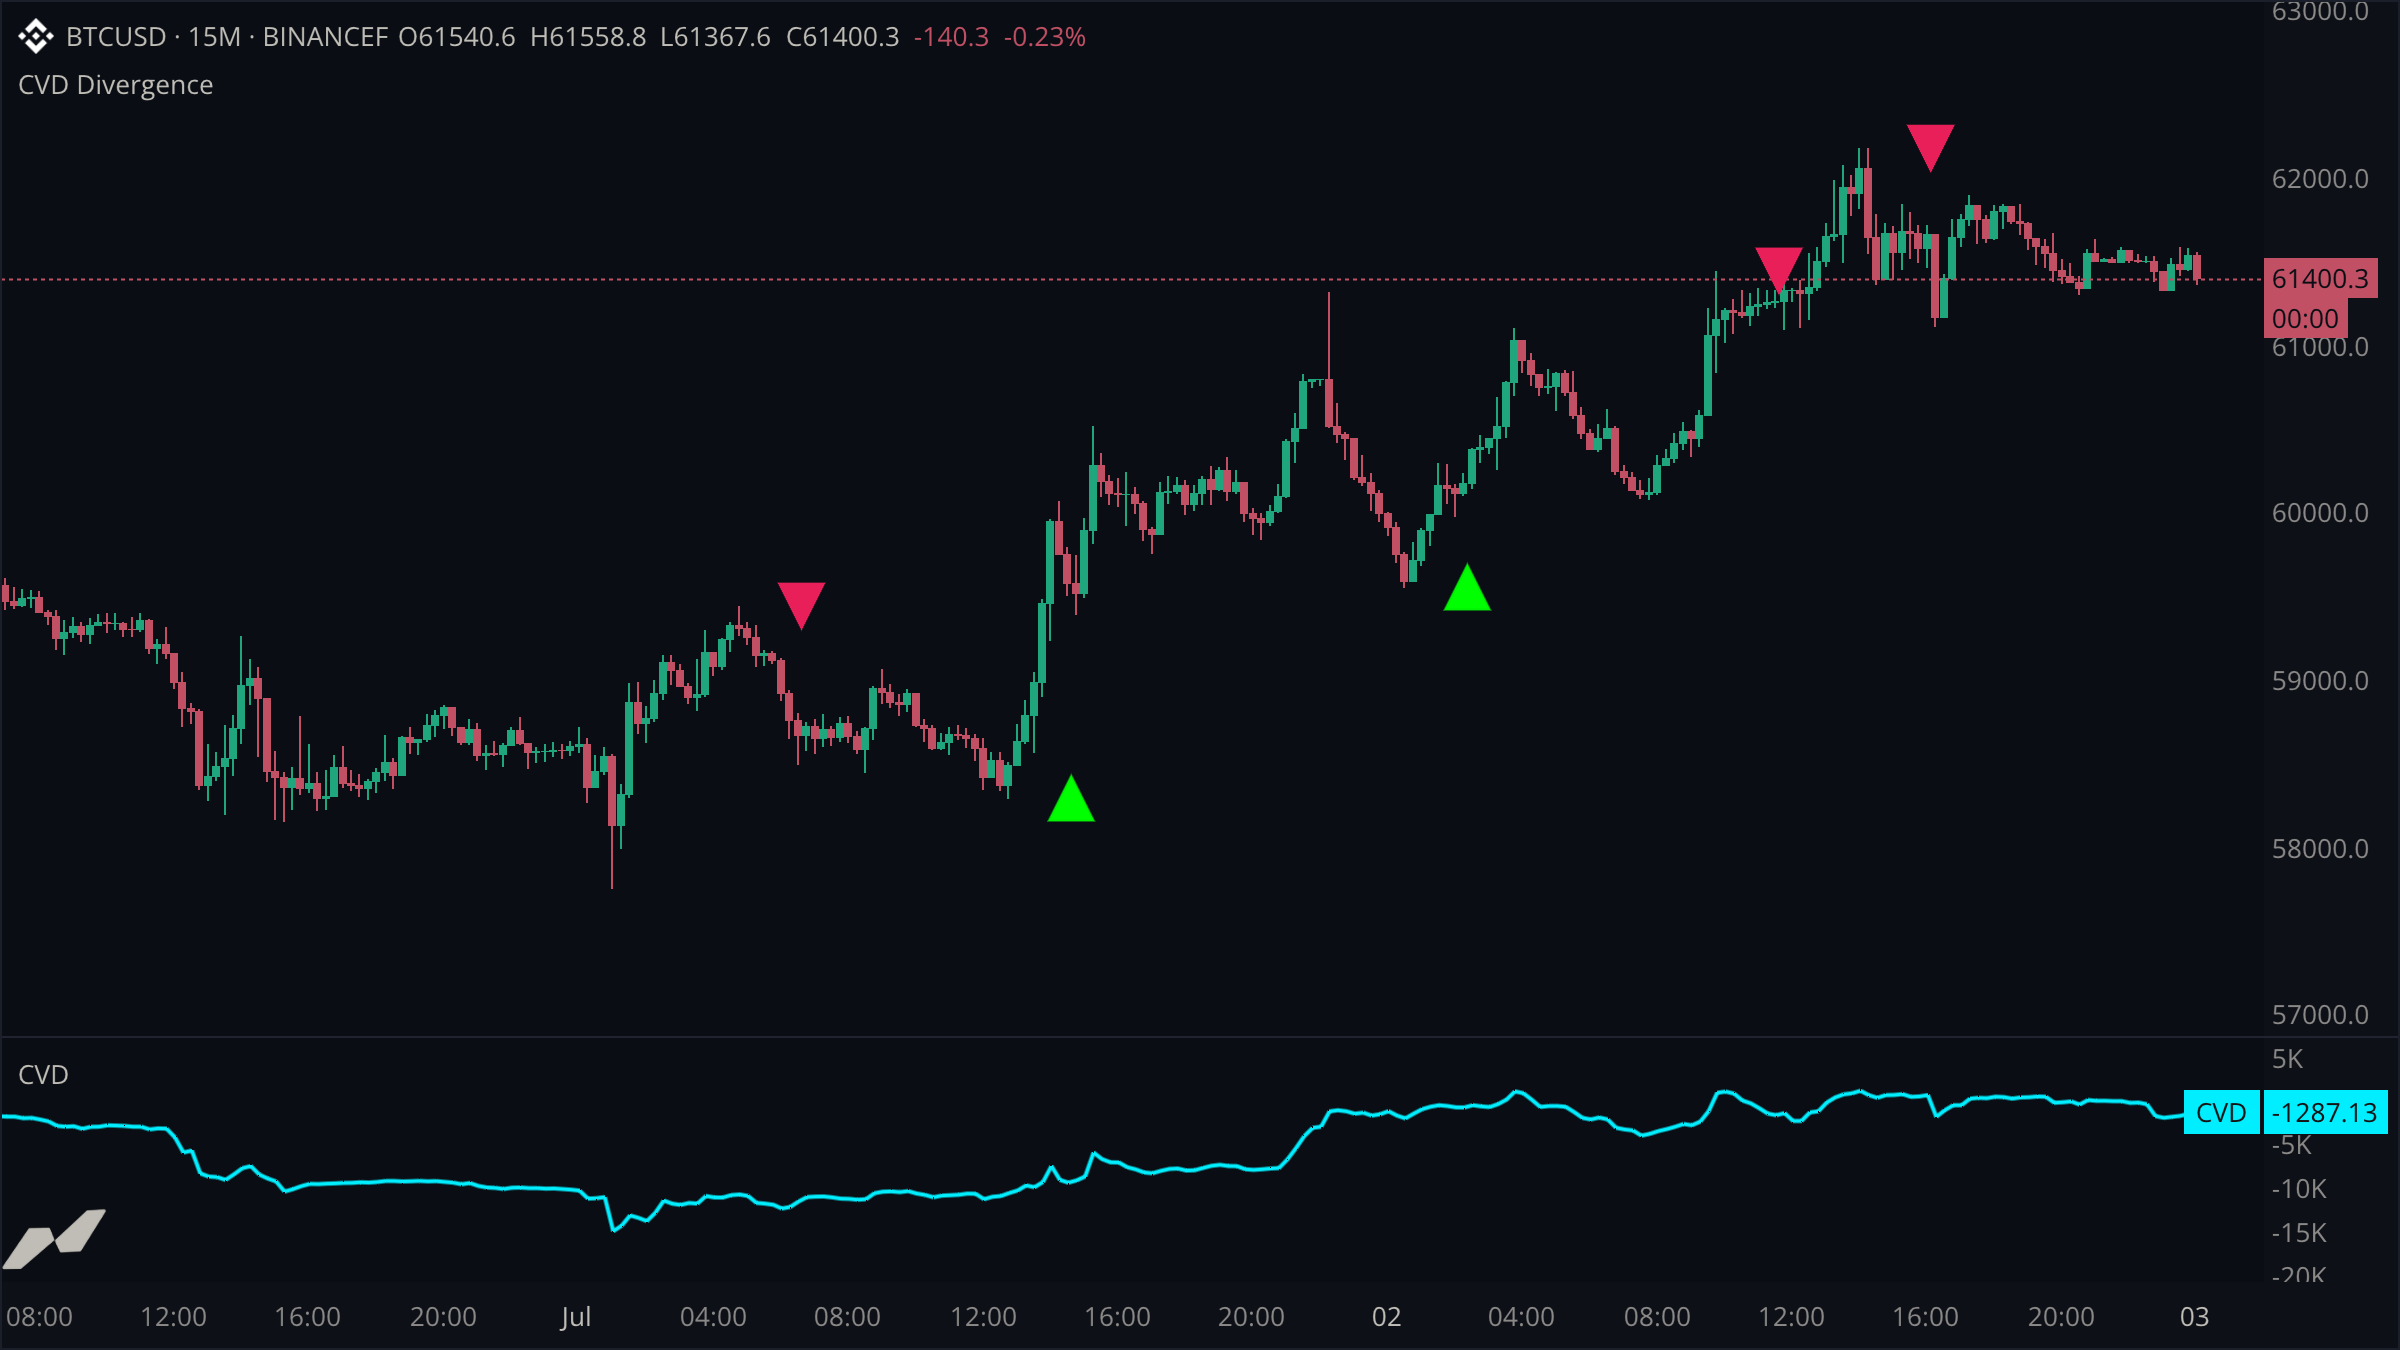
script "CVD Divergence"

data chart = subscribe(data.ohlcv)
data cvd = subscribe(data.cvd)

input pivotLen = input.int(8, title: "Pivot Strength", min: 2, max: 30)

pane cvdPane = pane(title: "CVD", height: 0.3)

plot cvdPlot = plot.line(title: "CVD", color: color.cyan, width: 2, on: cvdPane)

state (
  markers = entities.markerPool(max: 24)
  slot: int = 0
  prevHighPrice: float? = null
  prevHighCvd:   float? = null
  prevLowPrice:  float? = null
  prevLowCvd:    float? = null
)

on chart.update {
  cvdPlot.plot(cvd.close)

  let now = (chart.time ?? time.fromUnixSeconds(0))
  let pivotTime = now - time.bars(pivotLen)

  // When a price pivot confirms, read the CVD value that printed on the
  // same bar and compare the pair against the previous swing.
  let pivotHigh = ta.pivotHigh(chart.high, pivotLen, pivotLen)
  if pivotHigh != null {
    let cvdAt = cvd.close[pivotLen]
    let ready = prevHighPrice != null && cvdAt != null
    let higherHigh = (pivotHigh ?? 0.0) > (prevHighPrice ?? 0.0)
    let weakerCvd = (cvdAt ?? 0.0) < (prevHighCvd ?? 0.0)
    if ready && higherHigh && weakerCvd {
      // Higher high in price, lower high in CVD: buyers are thinning out.
      slot = slot >= 23 ? 0 : slot + 1
      markers.get("bear", slot).set(
        x: pivotTime,
        y: (pivotHigh ?? 0.0),
        shape: shape.down,
        color: color.red,
        size: 11.0,
      )
    }
    prevHighPrice = pivotHigh
    prevHighCvd = cvdAt
  }

  let pivotLow = ta.pivotLow(chart.low, pivotLen, pivotLen)
  if pivotLow != null {
    let cvdAt = cvd.close[pivotLen]
    let ready = prevLowPrice != null && cvdAt != null
    let lowerLow = (pivotLow ?? 0.0) < (prevLowPrice ?? 0.0)
    let strongerCvd = (cvdAt ?? 0.0) > (prevLowCvd ?? 0.0)
    if ready && lowerLow && strongerCvd {
      // Lower low in price, higher low in CVD: sellers are thinning out.
      slot = slot >= 23 ? 0 : slot + 1
      markers.get("bull", slot).set(
        x: pivotTime,
        y: (pivotLow ?? 0.0),
        shape: shape.up,
        color: color.green,
        size: 11.0,
      )
    }
    prevLowPrice = pivotLow
    prevLowCvd = cvdAt
  }
}
Two streams, one clock
cvd.close inside the chart handler reads the CVD bar aligned with the current chart bar. Bracket indexing works across streams too: cvd.close[pivotLen] is the CVD value from the same bar as the price pivot being confirmed.
Compare swing pairs, not raw series
Divergence is a statement about consecutive swings. The script stores the previous pivot's price and CVD in state, and only signals when the new pair disagrees in direction: higher high in price with a lower high in delta, or the mirror image at lows.
Markers need entities here
plot.marker draws on the current bar, but a divergence confirms pivotLen bars after the swing it belongs to. A pooled marker with an explicit x: anchors the signal to the bar that earned it.