

Swing levels
Turn confirmed pivots into support and resistance rays with pooled lines and labels.
This example tracks the most recent confirmed swing high and swing low, extends each as a level until price trades through it, and tags it with a formatted price label. It covers entity pools, pivot confirmation lag, and str.format.
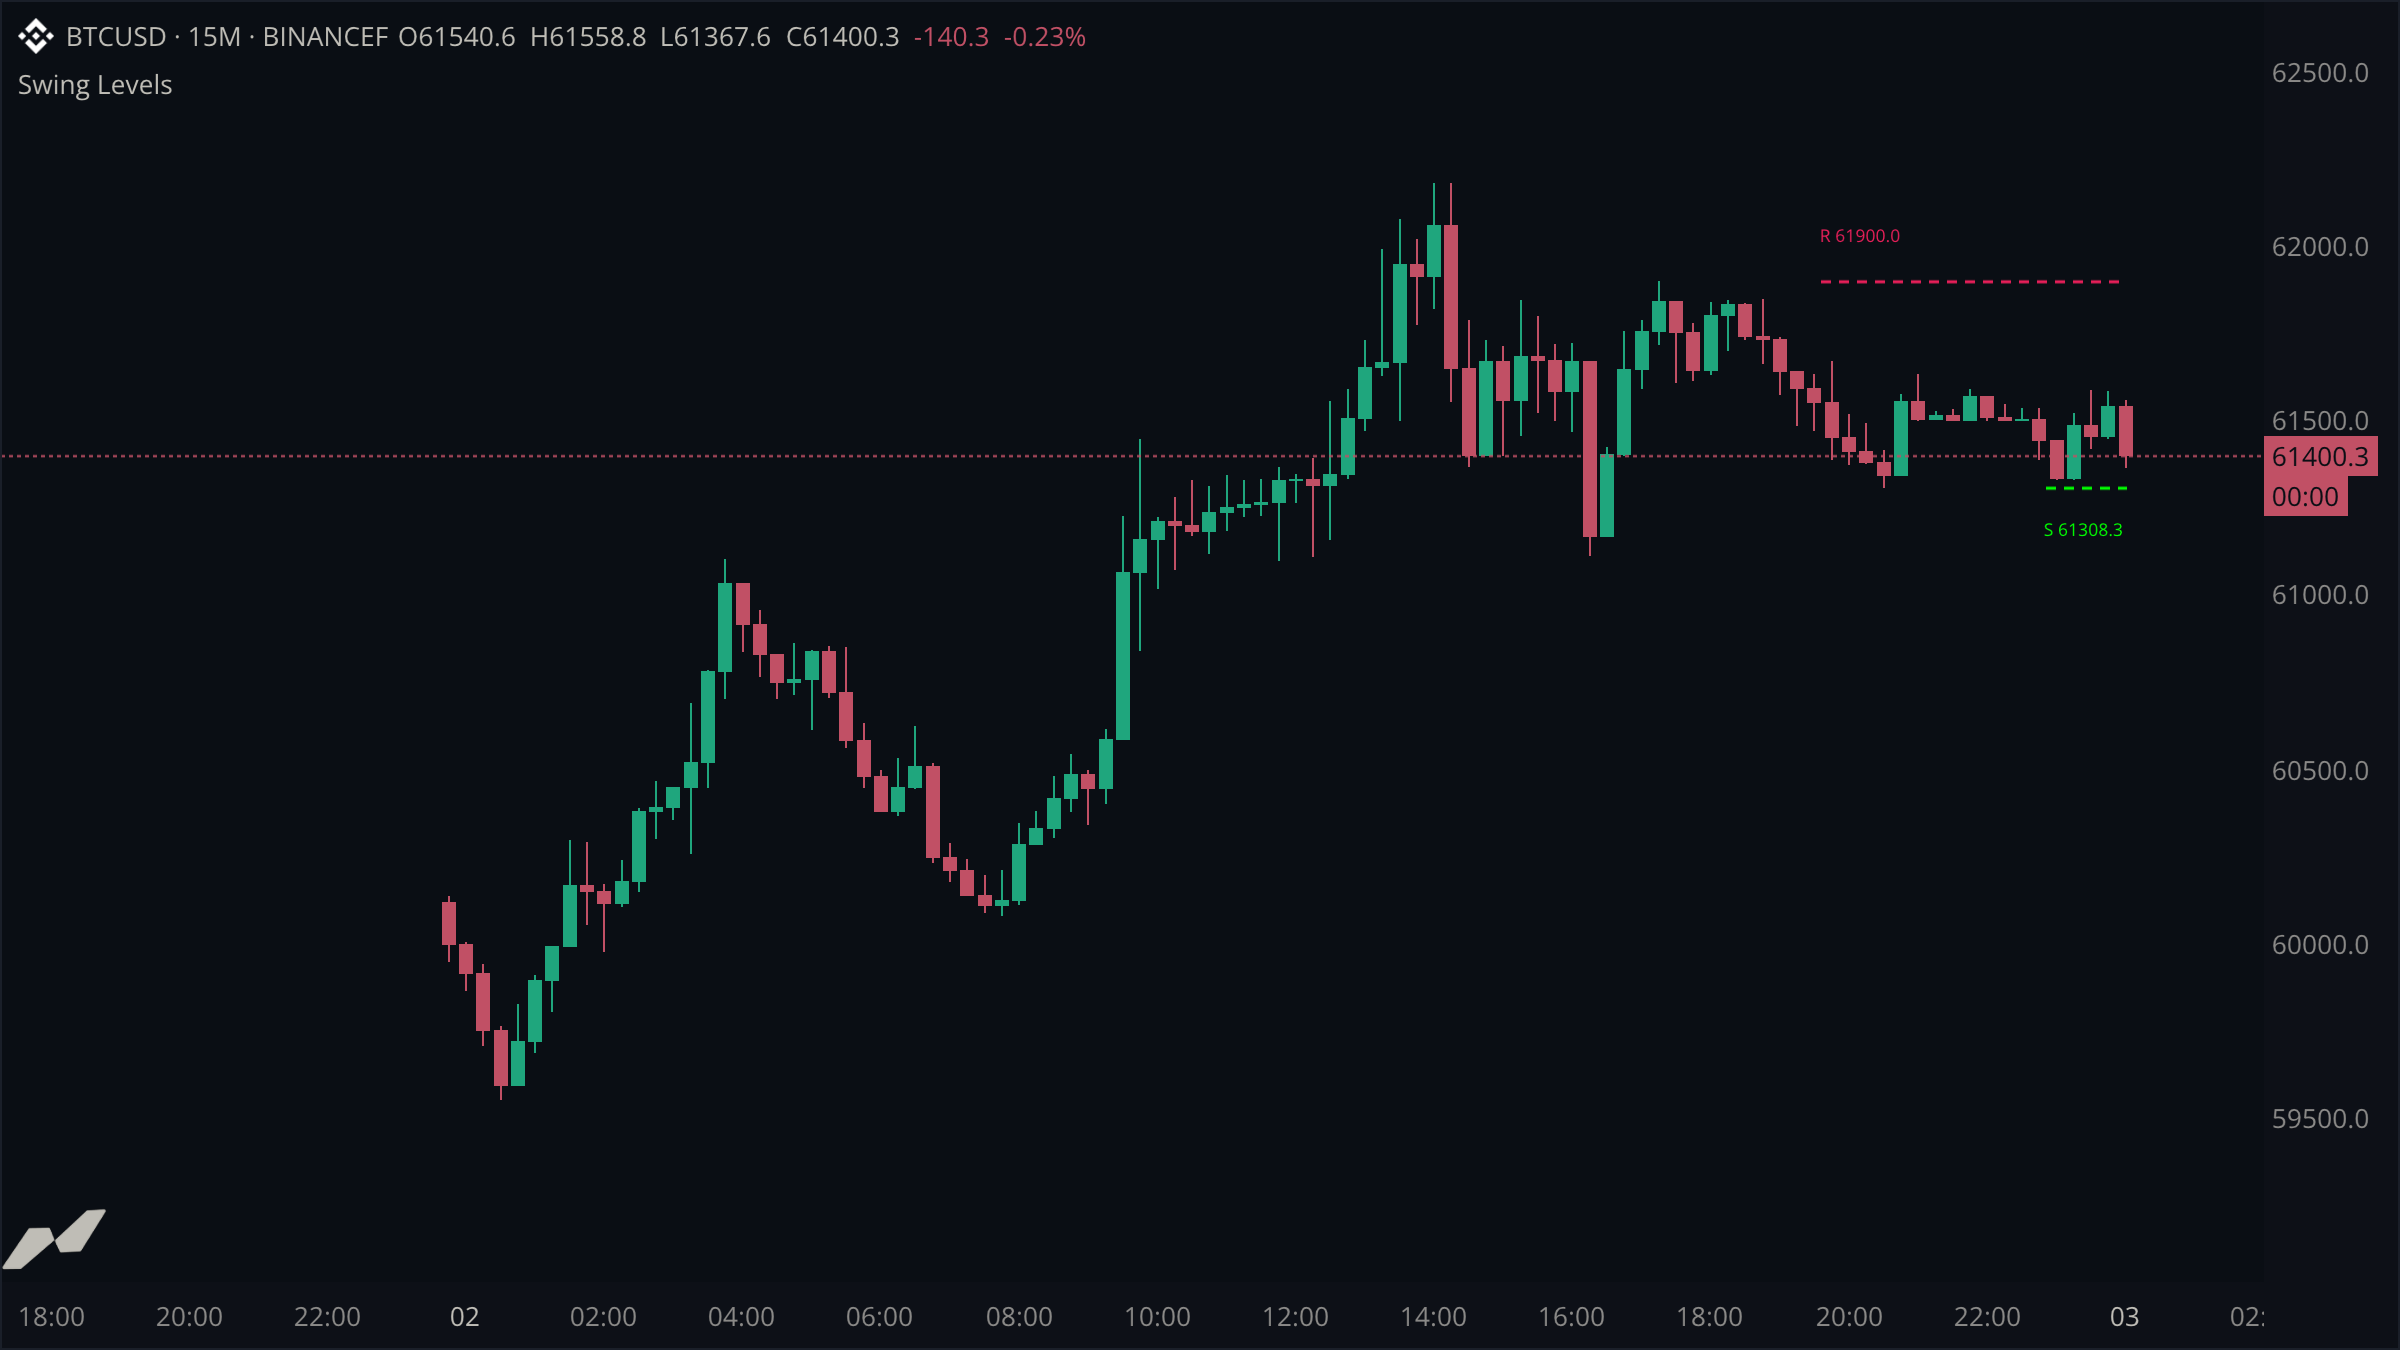
script "Swing Levels"

data chart = subscribe(data.ohlcv)

input (
  pivotLen        = input.int(10, title: "Pivot Strength", min: 1, max: 50)
  resistanceColor = input.color(color.red, title: "Resistance")
  supportColor    = input.color(color.green, title: "Support")
)

state (
  lines  = entities.linePool(max: 2)
  labels = entities.labelPool(max: 2)
  highLevel: float? = null
  highStart: time?  = null
  lowLevel:  float? = null
  lowStart:  time?  = null
)

fn drawLevel(key: string, start: time, end: time, level: float, labelY: float, tag: string, levelColor: color) {
  lines.get(key).set(
    x1: start,
    y1: level,
    x2: end,
    y2: level,
    color: levelColor,
    width: 1.5,
    style: linestyle.dashed,
  )
  labels.get(key).set(
    x: start,
    y: labelY,
    text: str.format("{0} {1:.1}", tag, level),
    color: levelColor,
    size: 12.0,
  )
}

on chart.update {
  let now = (chart.time ?? time.fromUnixSeconds(0))
  let last = (chart.close ?? 0.0)
  // Lift labels off the level line by a volatility-scaled offset so they
  // stay readable at any price scale.
  let pad = (chart.atr(14) ?? 0.0) * 0.8

  // A pivot confirms pivotLen bars after it happened, so anchor the level
  // back at the bar that actually set it.
  let pivotHigh = ta.pivotHigh(chart.high, pivotLen, pivotLen)
  if pivotHigh != null {
    highLevel = pivotHigh
    highStart = now - time.bars(pivotLen)
  }

  let pivotLow = ta.pivotLow(chart.low, pivotLen, pivotLen)
  if pivotLow != null {
    lowLevel = pivotLow
    lowStart = now - time.bars(pivotLen)
  }

  // Extend each level to the current bar until price trades through it.
  if highLevel != null && last > (highLevel ?? 0.0) {
    lines.delete("high")
    labels.delete("high")
    highLevel = null
  } else if highLevel != null {
    drawLevel("high", (highStart ?? now), now, (highLevel ?? 0.0), (highLevel ?? 0.0) + pad, "R", resistanceColor)
  }

  if lowLevel != null && last < (lowLevel ?? 0.0) {
    lines.delete("low")
    labels.delete("low")
    lowLevel = null
  } else if lowLevel != null {
    drawLevel("low", (lowStart ?? now), now, (lowLevel ?? 0.0), (lowLevel ?? 0.0) - pad, "S", supportColor)
  }
}
Pivots confirm late
ta.pivotHigh(chart.high, 10, 10) only returns a value once ten bars have printed on each side of the candidate. The level is real from the pivot bar onward, so the script rewinds the anchor with now - time.bars(pivotLen) instead of starting the ray at the confirmation bar.
Entities are keyed and finite
Pools are declared with a hard max and addressed by key. lines.get("high") returns the same line every bar, so re-issuing set extends it in place. Deleting the key when price breaks the level removes the ray instead of leaving a stale artifact.
Factor the drawing, not the logic
Both sides share one drawLevel function that positions a line and its label together. The break/extend decision stays inline per side, where the asymmetry (break above vs. break below) is easiest to read.