

Trend candles
Repaint the chart's candles by trend state and mark trend flips with signal markers.
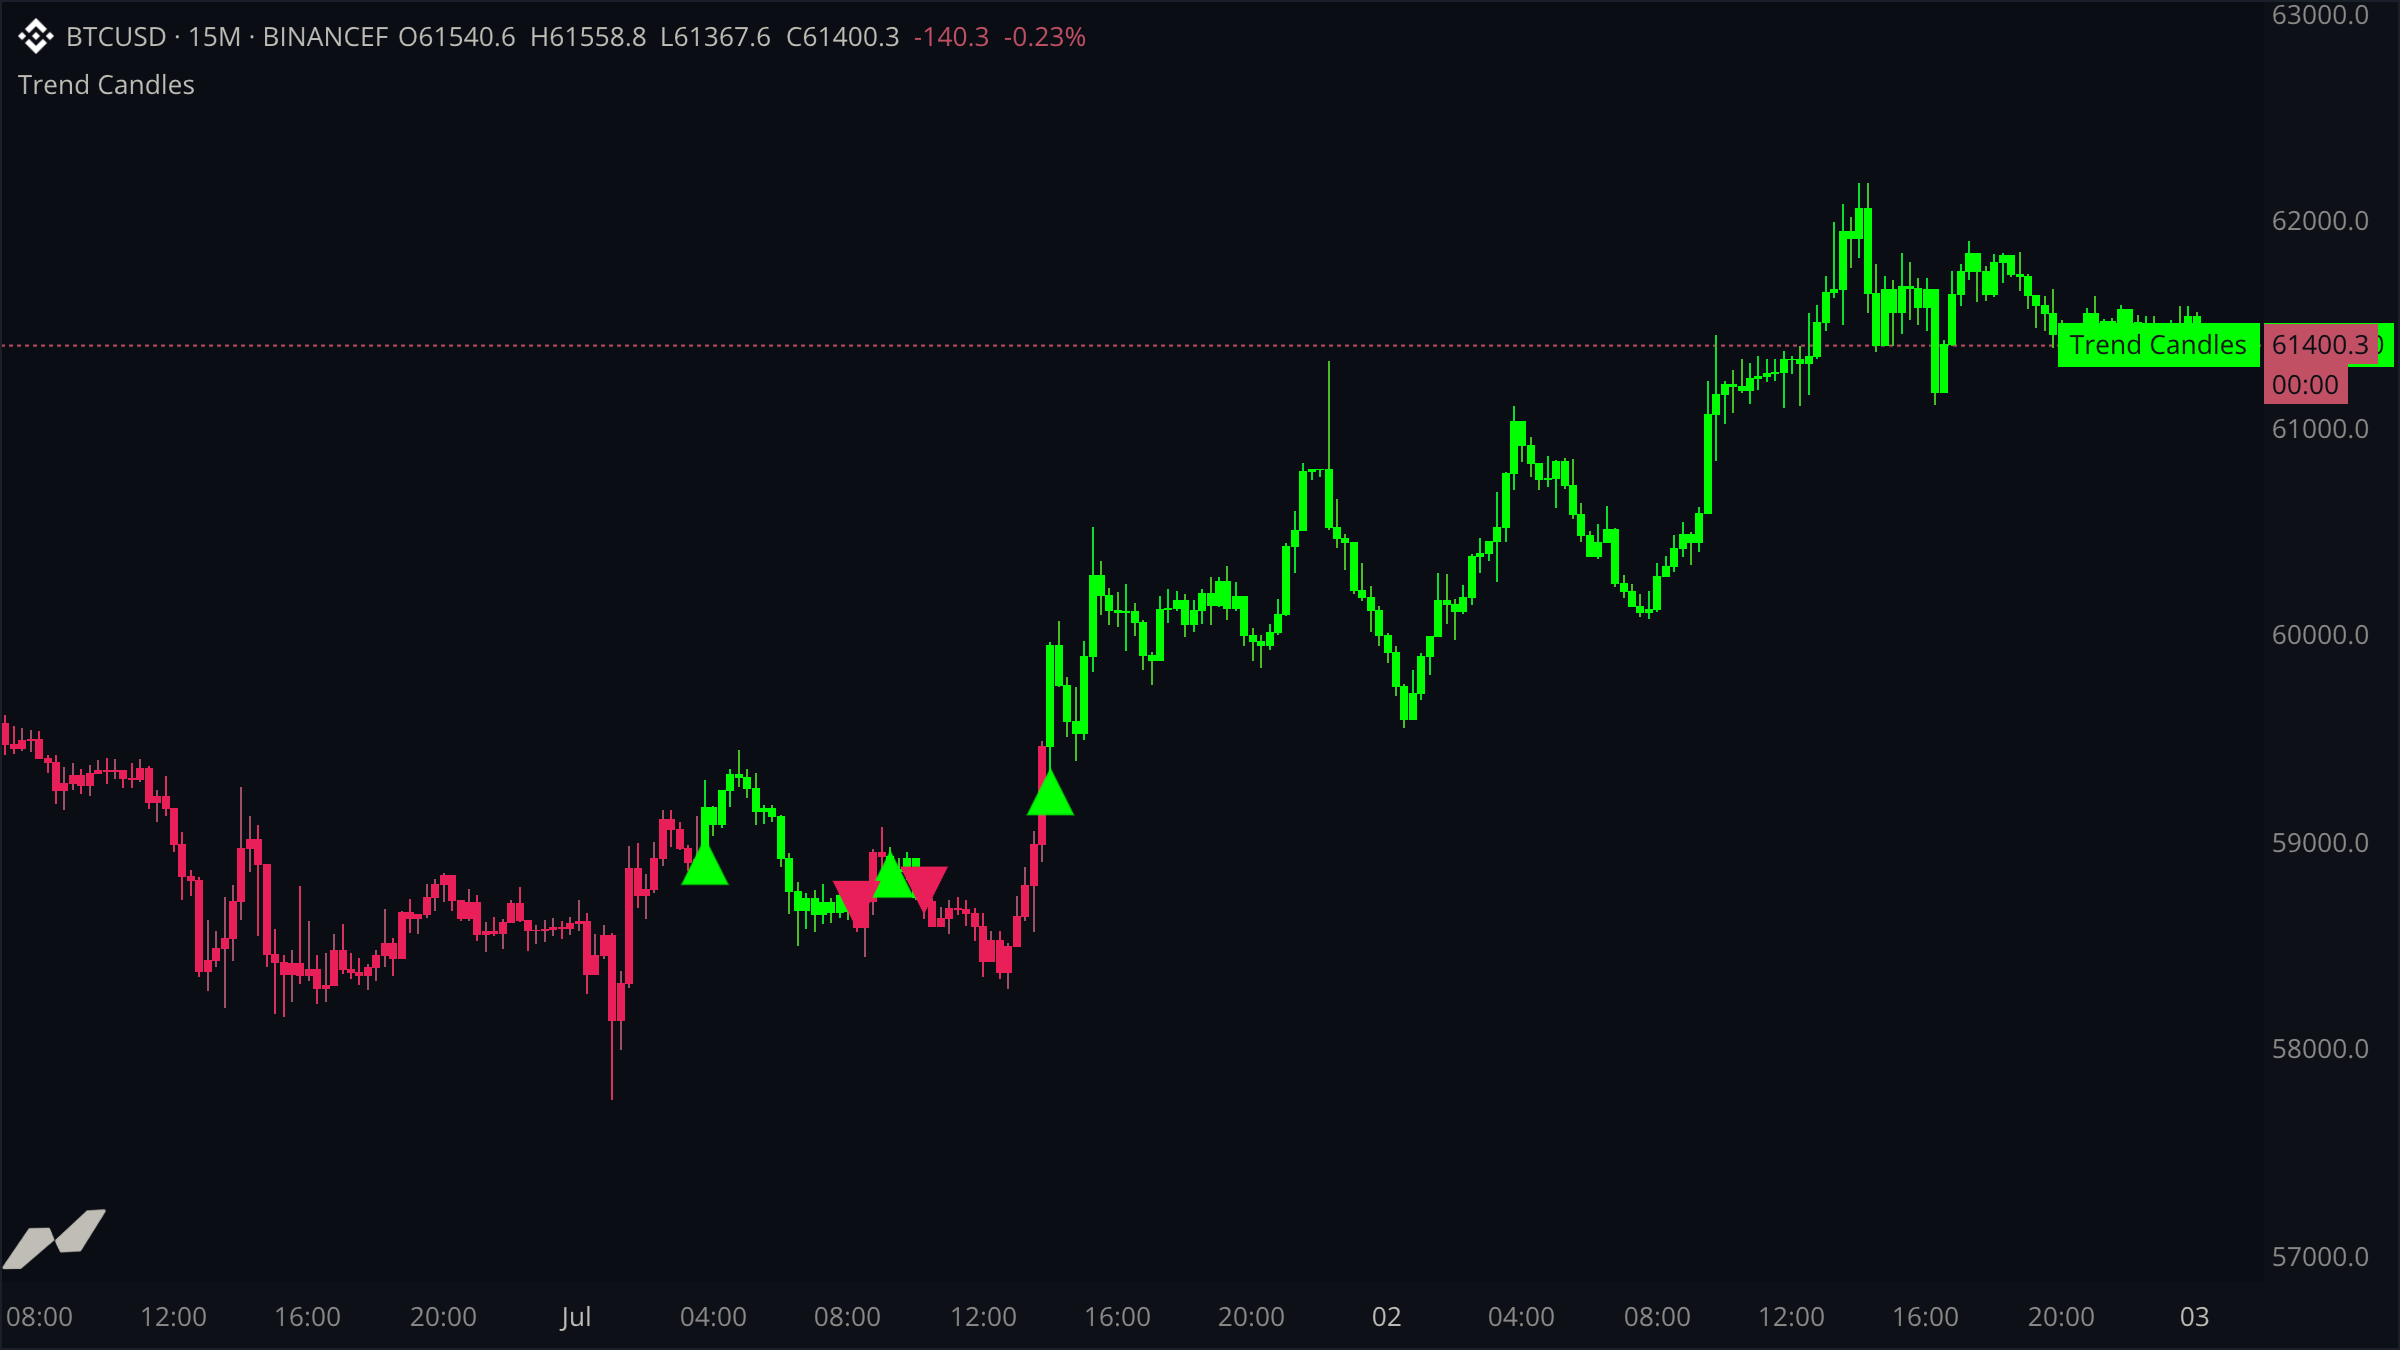
This example replaces the chart's direction-colored candles with trend-colored ones, then drops a marker on the bar where the trend flips. It covers plot.candle, plot.marker, and the crossover helpers.
script "Trend Candles"

data chart = subscribe(data.ohlcv)

input (
  fastLen = input.int(21, title: "Fast EMA", min: 1, max: 200)
  slowLen = input.int(55, title: "Slow EMA", min: 2, max: 400)
)

plot (
  candles    = plot.candle(title: "Trend Candles")
  longEntry  = plot.marker(title: "Long", shape: shape.up, color: color.green, size: 11)
  shortEntry = plot.marker(title: "Short", shape: shape.down, color: color.red, size: 11)
)

on chart.update {
  let fast = ta.ema(chart.close, fastLen)
  let slow = ta.ema(chart.close, slowLen)
  let up = (fast ?? 0.0) >= (slow ?? 0.0)

  // Repaint each candle by trend instead of by direction. A null component
  // would skip the bar, so this only paints once both averages are ready.
  let ready = fast != null && slow != null
  let body = !ready ? color.gray : up ? color.up : color.down
  candles.plot(
    chart.open,
    chart.high,
    chart.low,
    chart.close,
    bodyColor: body,
    wickColor: color.withAlpha(body, 160),
    borderColor: body,
  )

  // Mark the bar where the trend flips. A null value emits no marker.
  let gap: float? = null
  longEntry.plot(ta.crossover(fast, slow) ? chart.low : gap)
  shortEntry.plot(ta.crossunder(fast, slow) ? chart.high : gap)
}
Candle plots are all-or-nothing
plot.candle skips the bar if any of open, high, low, or close is null. That makes it safe to pass the chart fields straight through without fallbacks; a data gap simply leaves a hole instead of drawing a broken candle.
Markers plot a price, or nothing
A marker call takes the price to draw at. Passing null emits no marker, so the crossover condition selects between the bar's low and nothing. The gap local names that nothing once, keeping both signal lines readable.
Anchoring signals to the bar
Long markers sit at chart.low and short markers at chart.high, so they hug the candle they belong to at any zoom level. Fixed offsets in price terms would drift as volatility changes.