

Footprint cells
Draw a bid x ask footprint and a delta profile inside each bar with a cells plot, keep the candles visible beside it, and choose how the numbers are written.
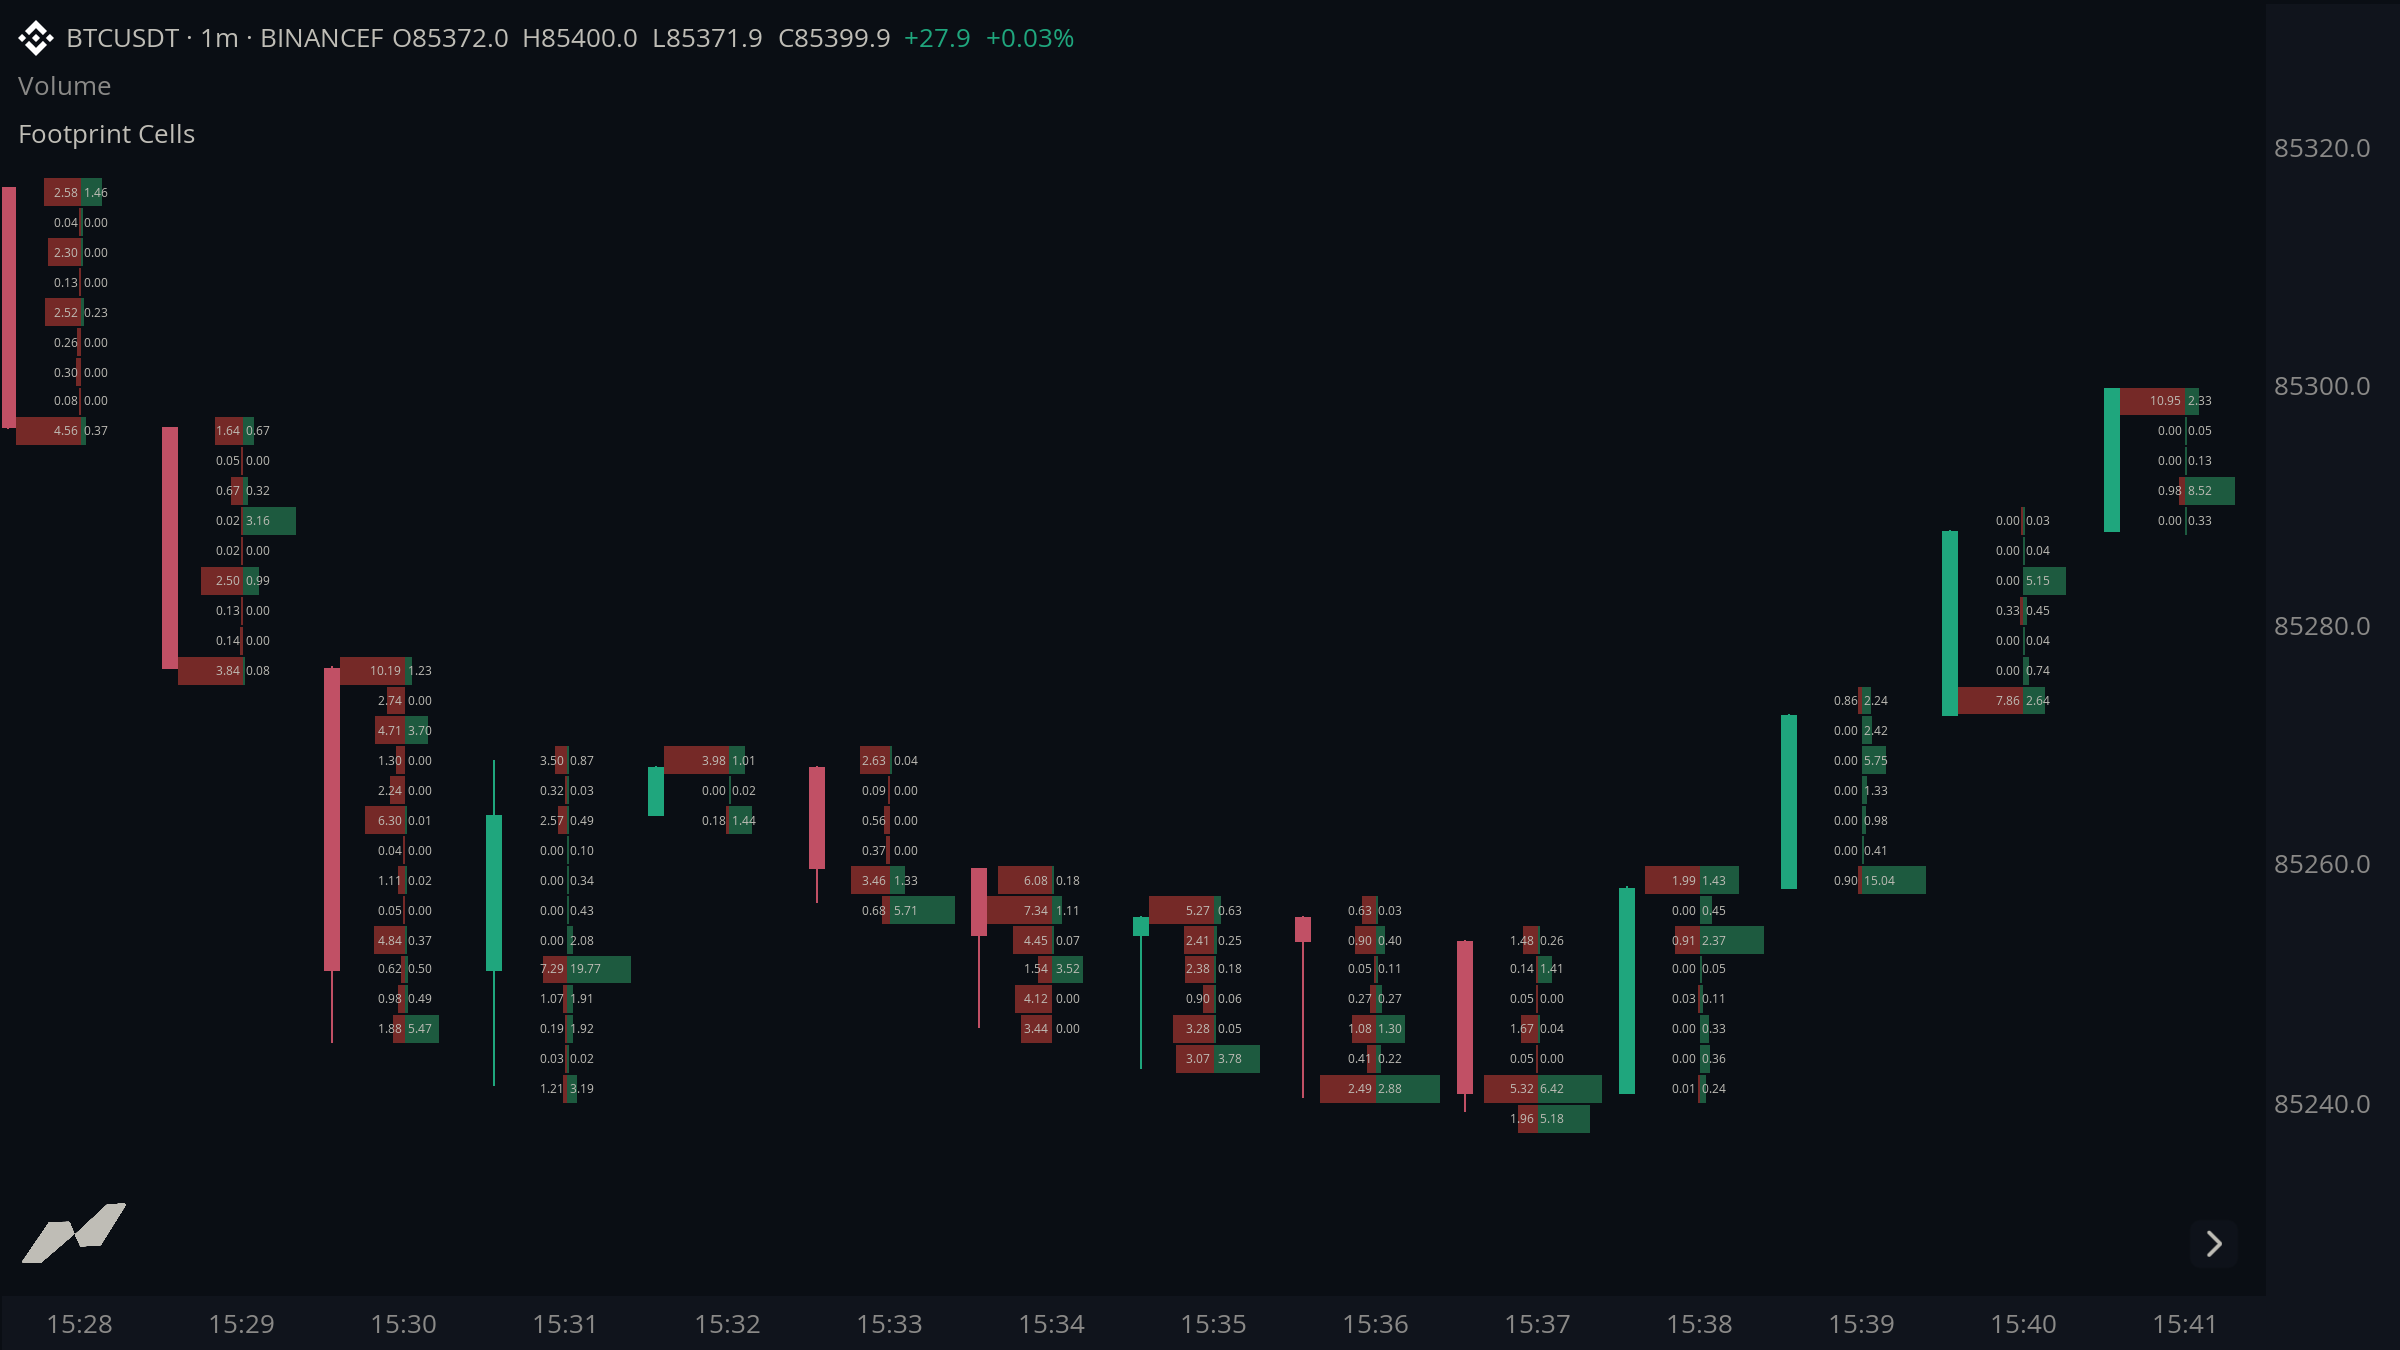
This example draws each bar's traded volume as rows of cells inside the bar. One input switches between a two-column bid x ask footprint and a one-column delta profile. It covers plot.cells, volume.bucketsByStep, the candles argument, and the number format arguments.
script "Footprint Cells"

data chart = subscribe(data.ohlcv)
data vol = subscribe(data.volume)

input (
  rowHeight    = input.float(25.0, title: "Row Height", min: 0.000001)
  deltaProfile = input.bool(false, title: "Delta Profile")
  buyColor     = input.color(#2fa66a80, title: "Buy")
  sellColor    = input.color(#e0443a80, title: "Sell")
  thinCandles  = input.bool(true, title: "Thin Candles")
  deltaDigits  = input.int(0, title: "Delta Decimals", min: 0, max: 8)
)

// Both plots ask for the same candles, whichever one is drawing. The
// footprint writes each volume with two decimals (3.26), so the numbers of a
// bar line up. When a bar is too narrow for a full number the chart shortens
// it by itself.
plot footprint = plot.cells(
  title: "Bid x Ask",
  columns: 2,
  candles: thinCandles ? cellcandles.side : cellcandles.overlay,
  format: cellformat.fixed,
  decimals: 2,
)
plot delta = plot.cells(
  title: "Delta Profile",
  columns: 1,
  candles: thinCandles ? cellcandles.side : cellcandles.overlay,
  format: cellformat.fixed,
  decimals: deltaDigits,
  sign: true,
  grouping: true,
)

on chart.update {
  // Rows sit on whole multiples of rowHeight, so they line up across bars.
  let rows = vol.bucketsByStep(rowHeight)
  if rows != null {
    // rows.time is the start of the volume period, which names its bar. The
    // clear matters when every row is skipped: without it the bar would keep
    // the cells of an earlier update.
    let bar = rows.time
    footprint.clear(time: bar)
    delta.clear(time: bar)
    for row in rows {
      if row.buy + row.sell > 0.0 {
        if deltaProfile {
          let d = row.buy - row.sell
          delta.cell(
            row.from,
            row.to,
            weight: math.abs(d),
            value: d,
            color: d >= 0.0 ? buyColor : sellColor,
            time: bar,
          )
        } else {
          footprint.cell(
            row.from,
            row.to,
            weight: row.sell,
            value: row.sell,
            color: sellColor,
            column: 0,
            align: align.right,
            time: bar,
          )
          footprint.cell(
            row.from,
            row.to,
            weight: row.buy,
            value: row.buy,
            color: buyColor,
            column: 1,
            align: align.left,
            time: bar,
          )
        }
      }
    }
  }
}
One plot, many cells per bar
A cells plot holds rows of cells for each bar. A cell is a price band (from to to) with an optional width, colors, and a number to show. Lines and histograms hold one value per bar, and entity pools cap how many boxes a script can keep; a cells plot is built for per-bar ladders such as footprints and profiles, and keeps them for as many bars as your plan's cell budget allows. When the budget is used, the oldest bars lose their cells first.
Rows that line up across bars
vol.bucketsByStep(rowHeight) groups the bar's volume into price rows that sit on whole multiples of rowHeight, so a row at 85,075 is the same row on every bar. It returns null when a bar would need more than 4,096 rows, so pick a row height that suits the market: about 25 for BTC, 1 for ETH, much smaller for low-priced symbols. The image above uses a row height of 2.5 on a quiet one-minute chart.
Width, columns, and the growth edge
weight sets how wide a cell is, relative to the largest weight on that bar. columns: 2 splits the bar into two halves; the sell cells sit in column 0 and grow leftward from the middle (align.right), the buy cells sit in column 1 and grow rightward (align.left). The delta profile uses one column and the size of the delta as its weight.
Writing to the right bar
rows.time is the start of the volume period the rows came from. Passing it as time: puts the cells on that bar, which matters at a bar close, when the handler runs after the next bar has opened. The first cell or clear in an update replaces what the bar held before, so the script calls clear to leave a bar empty when every row is skipped.
Candles beside the cells
A footprint normally covers the chart's candles. candles: cellcandles.side draws each candle as a thin strip at the left edge of its bar, beside the cells. cellcandles.hidden draws no candles, and cellcandles.overlay (the default) leaves them behind the cells. The argument is set when the plot is declared, so the example reads it from an input.
Choosing how numbers are written
By default a cell's value is shortened with a suffix, such as 3.21K. The footprint asks for two decimals with format: cellformat.fixed, decimals: 2, so every volume in a bar is written the same way. The delta profile asks for whole numbers with a sign and thousands separators:
plot delta = plot.cells(
  title: "Delta Profile",
  format: cellformat.fixed,
  decimals: 0,
  sign: true,
  grouping: true,
)| Arguments | 3214.56 | 53,100,000 |
|---|---|---|
default (cellformat.compact) | 3.21K | 53.1M |
cellformat.compact, decimals: 0 | 3K | 53M |
cellformat.fixed, decimals: 2 | 3214.56 | 53100000.00 |
cellformat.fixed, decimals: 0, grouping: true | 3,215 | 53,100,000 |
cellformat.fixed, decimals: 0, sign: true, grouping: true | +3,215 | +53,100,000 |
cellformat.percent treats the value as a ratio, so 0.153 with decimals: 1 reads 15.3%. The format you declare is the most detail a cell shows: when a bar is too narrow, the chart drops decimals and then shortens the number by itself, and shows no text only when nothing fits. Leave decimals out to let the chart pick the digits.
See the plot.cells reference for every argument.