

Examples
CVD & Volume Delta
Examples using cumulative volume delta and volume delta data with bucket filtering.
Legacy Scripting v2
These docs remain available while the v2 engine is supported. For new scripts, use Scripting v3.
Basic CVD Plot
Subscribe to data.CVD and plot the close as a line.
//@version=2
indicator("CVD", false);
const cvd = subscribe(data.CVD, { bucket: 1 });

function onBar() {
  plot("CVD", cvd.close(), { color: color.orange });
}
Bucketed CVD — Small / Mid / Whale
Splits CVD into three trade-size tiers and plots each as its own candle series. This lets you see which participant class is driving net buying or selling pressure.
| Tier | Dollar Range | Buckets |
|---|---|---|
| Small | <$25K | 2, 3, 4 |
| Mid | $25K–$500K | 5, 6, 7, 8 |
| Whale | $500K+ | 9, 10, 11 |
Why skip bucket 1?
Bucket 1 is the "all trades" bucket. This script uses the granular buckets (2–11) to separate by size, so bucket 1 is not needed.
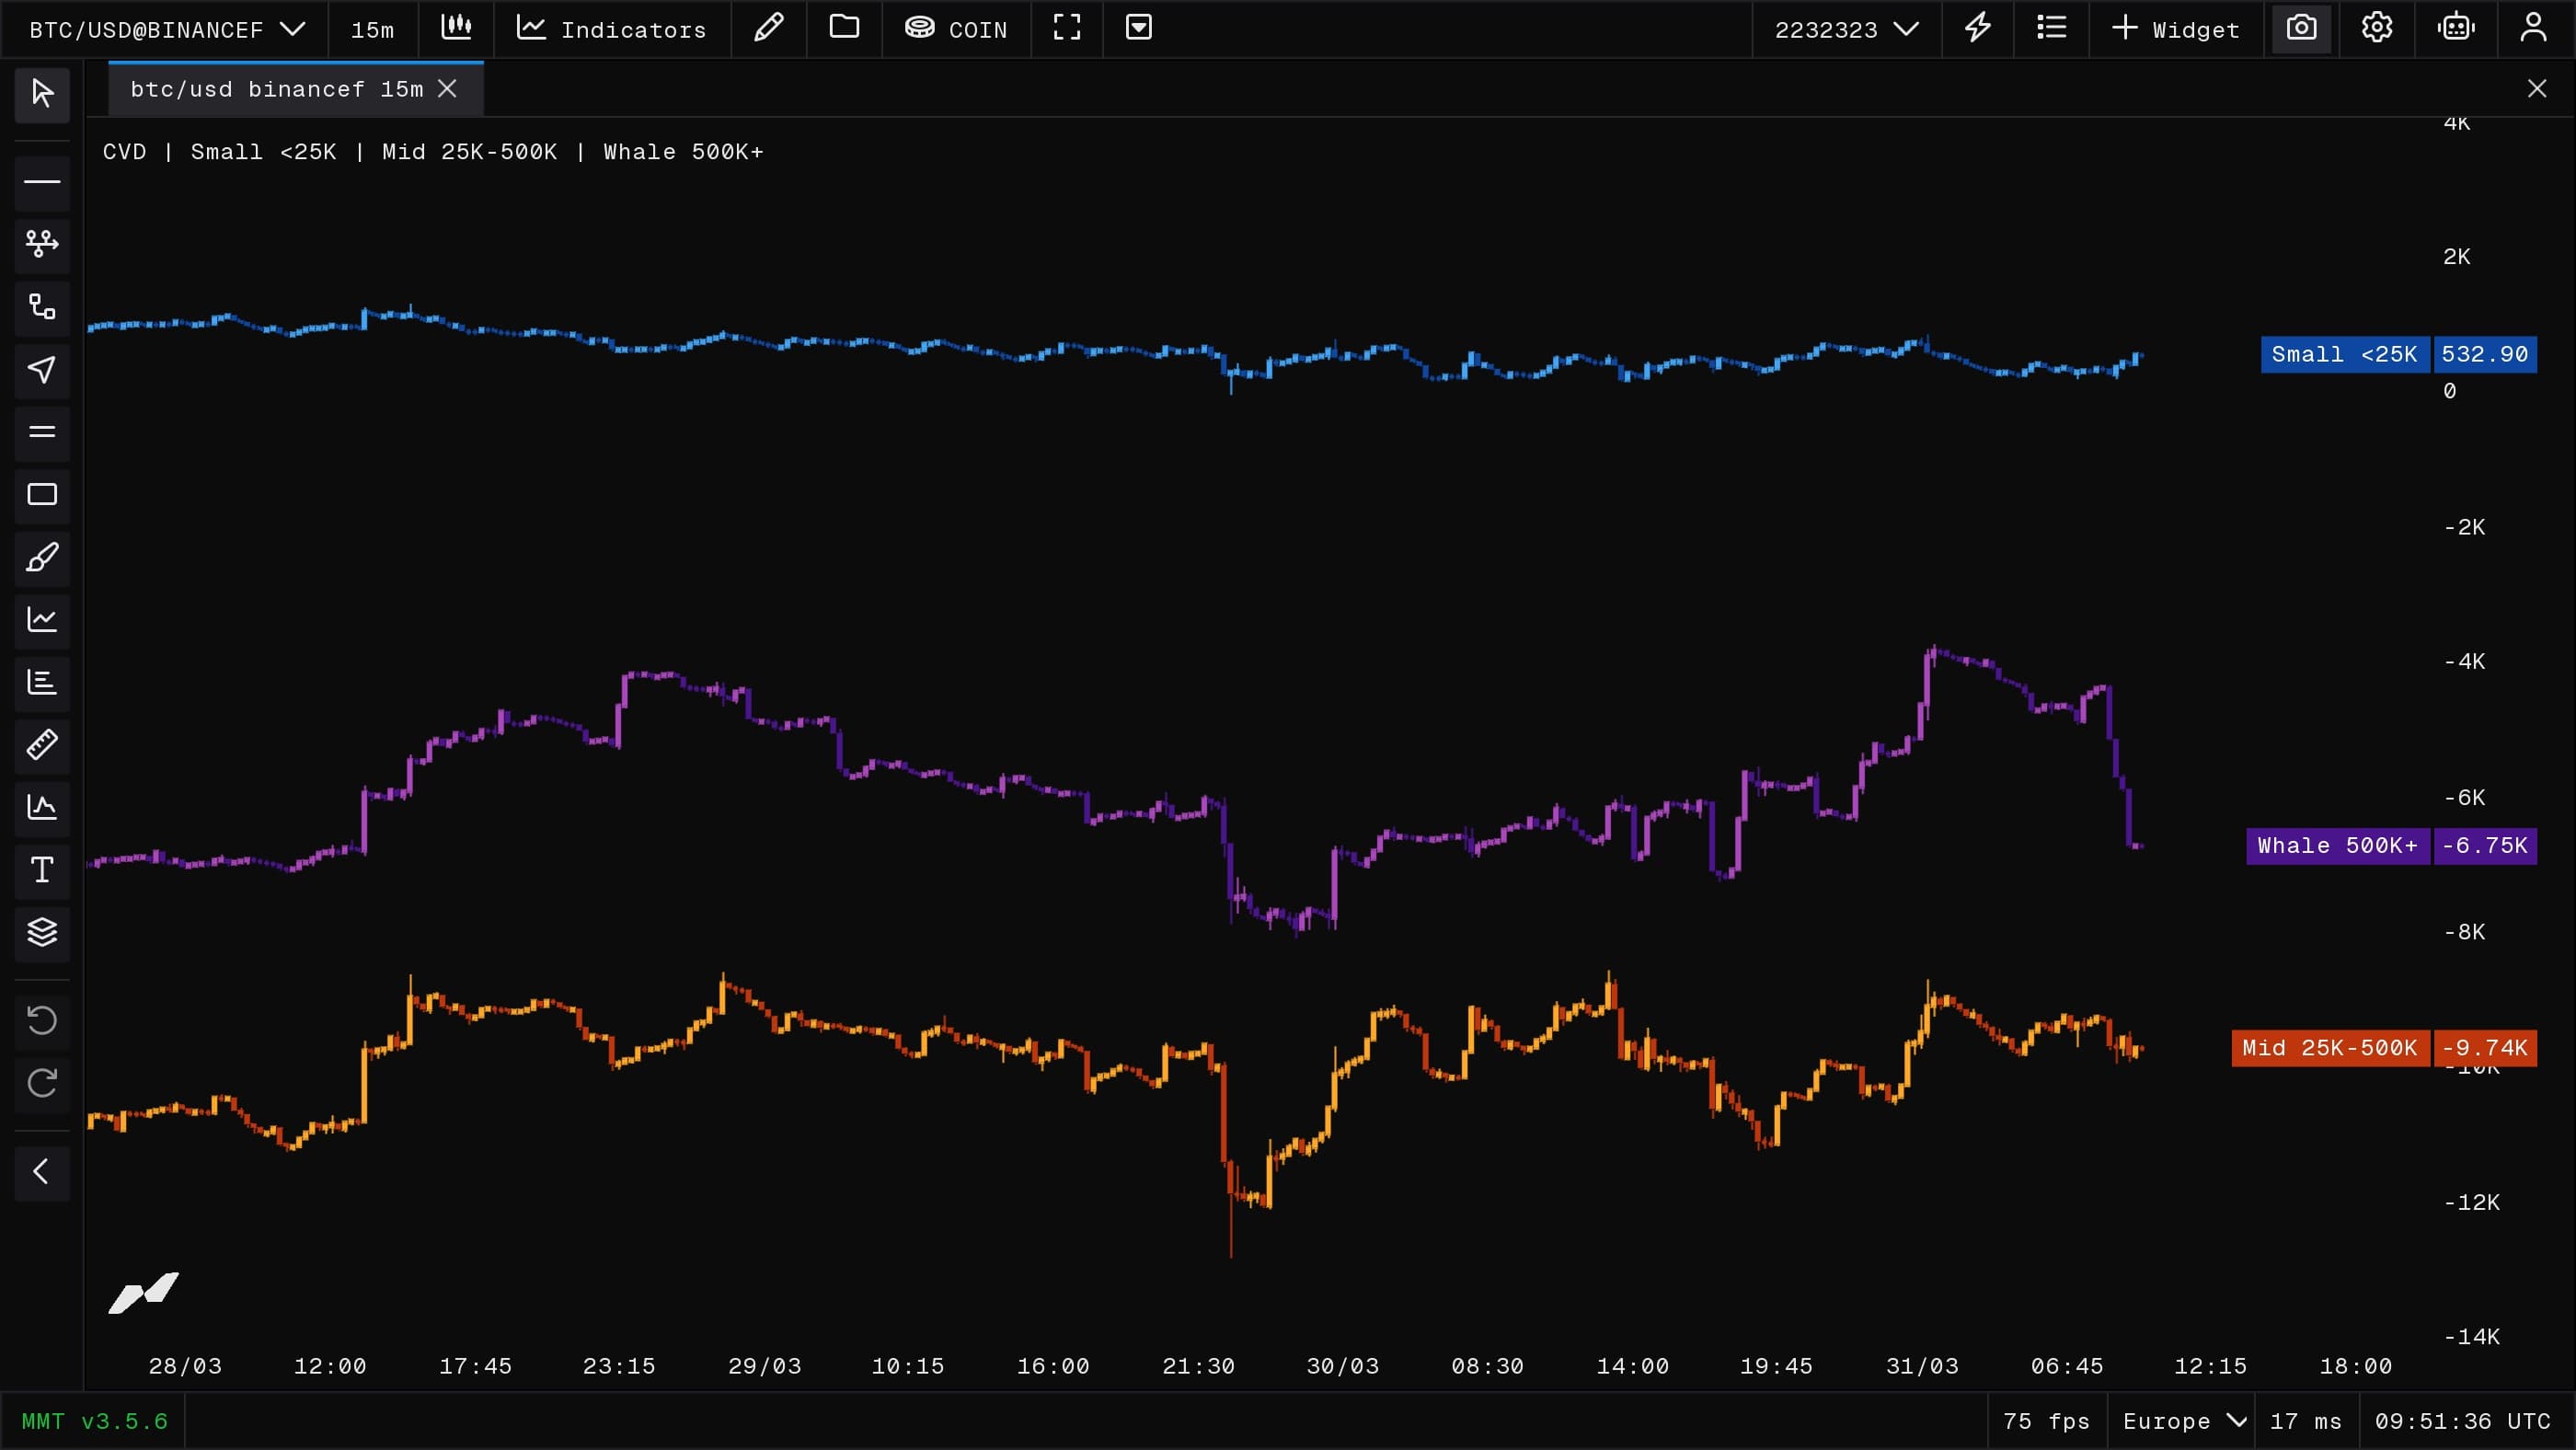
//@version=2
indicator("CVD | Small <25K | Mid 25K-500K | Whale 500K+", false);

// Color inputs
const smallBull = input.color("Small Bull", "#42a5f7");
const smallBear = input.color("Small Bear", "#0d47a1", { sameLine: true });

const midBull = input.color("Mid Bull", "#ffa726");
const midBear = input.color("Mid Bear", "#bf360c", { sameLine: true });

const whaleBull = input.color("Whale Bull", "#ab47bc");
const whaleBear = input.color("Whale Bear", "#4a148c", { sameLine: true });

// Small: <$25K (buckets 2-4)
const s1 = subscribe(data.CVD, { bucket: 2 });
const s2 = subscribe(data.CVD, { bucket: 3 });
const s3 = subscribe(data.CVD, { bucket: 4 });

// Mid: $25K–$500K (buckets 5-8)
const m1 = subscribe(data.CVD, { bucket: 5 });
const m2 = subscribe(data.CVD, { bucket: 6 });
const m3 = subscribe(data.CVD, { bucket: 7 });
const m4 = subscribe(data.CVD, { bucket: 8 });

// Whale: $500K+ (buckets 9-11)
const w1 = subscribe(data.CVD, { bucket: 9 });
const w2 = subscribe(data.CVD, { bucket: 10 });
const w3 = subscribe(data.CVD, { bucket: 11 });

function onBar(index) {
  const sO = s1.open() + s2.open() + s3.open();
  const sH = s1.high() + s2.high() + s3.high();
  const sL = s1.low() + s2.low() + s3.low();
  const sC = s1.close() + s2.close() + s3.close();

  const mO = m1.open() + m2.open() + m3.open() + m4.open();
  const mH = m1.high() + m2.high() + m3.high() + m4.high();
  const mL = m1.low() + m2.low() + m3.low() + m4.low();
  const mC = m1.close() + m2.close() + m3.close() + m4.close();

  const wO = w1.open() + w2.open() + w3.open();
  const wH = w1.high() + w2.high() + w3.high();
  const wL = w1.low() + w2.low() + w3.low();
  const wC = w1.close() + w2.close() + w3.close();

  const sColor = sC >= sO ? smallBull : smallBear;
  const mColor = mC >= mO ? midBull : midBear;
  const wColor = wC >= wO ? whaleBull : whaleBear;

  plotCandle("Small <25K", sO, sH, sL, sC, {
    bodyColor: sColor,
    wickColor: sColor,
    borderColor: sColor
  });

  plotCandle("Mid 25K-500K", mO, mH, mL, mC, {
    bodyColor: mColor,
    wickColor: mColor,
    borderColor: mColor
  });

  plotCandle("Whale 500K+", wO, wH, wL, wC, {
    bodyColor: wColor,
    wickColor: wColor,
    borderColor: wColor
  });
}